For 40 years, we've been driving our country's economic and social progress. Four decades shaping Spain.
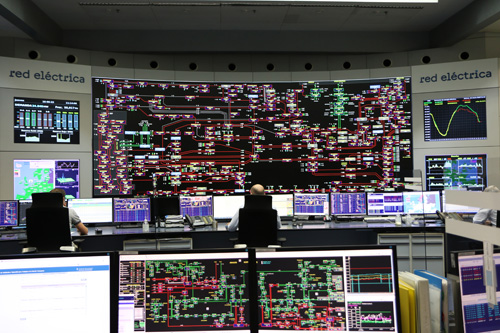

Electricity system data
Real
Forecast
Scheduled
Emissions (t CO2 eq/h)
No hay datos disponibles
No hay datos para mostrar
1/3
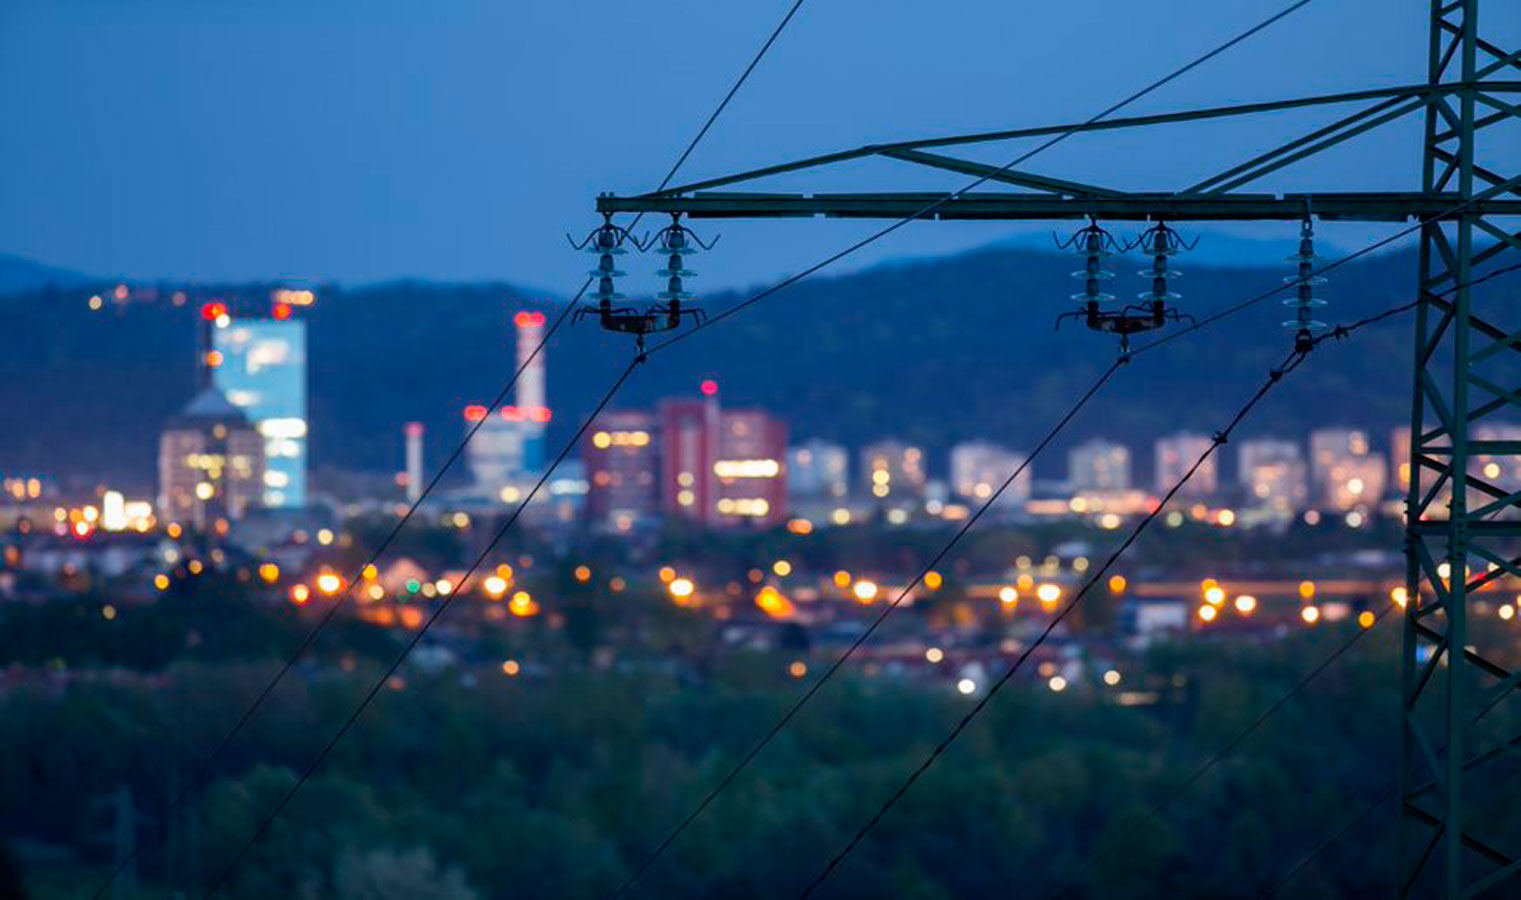
Transmission
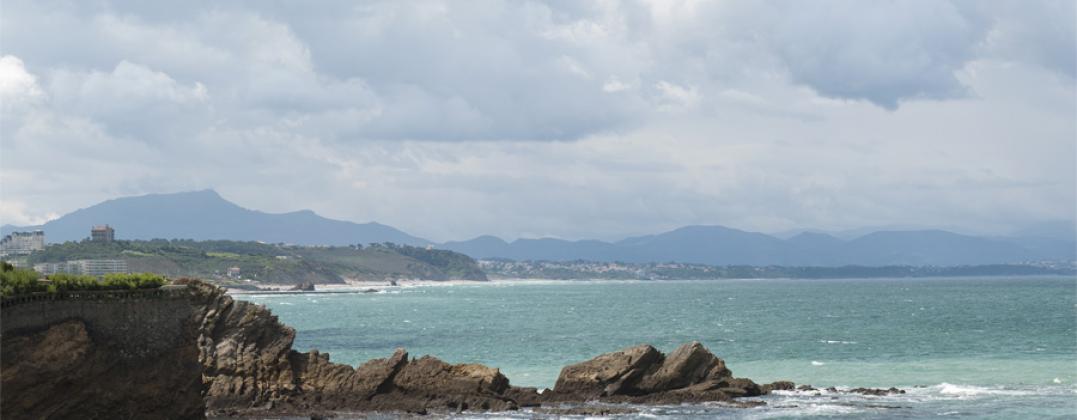
Interconnection with France
With the new interconnection with France via the Bay of Biscay, we will be able to double our exchange capacity with France, reinforcing the security of both systems and making joint progress in the energy transition.
2/3
Transmission
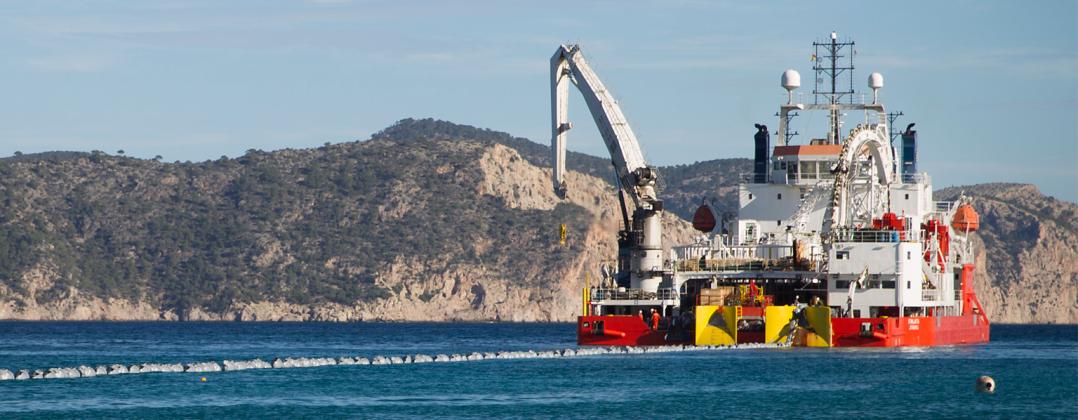
Second Peninsula-Balearic Islands link
This second link begins public consultation to define a project based on consensus with society.
3/3
Transmission
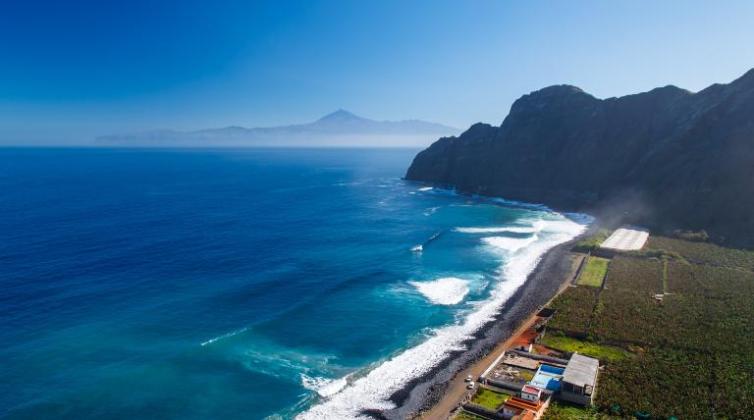
Tenerife-La Gomera link
The future link, which we are developing, will be a turning point for the ecological transition of the Canary Islands. On the one hand, it provides the capacity to cover the island of La Gomera's total demand, and allows the integration of a new renewable quota from La Gomera into the Tenerife system.
Highlights
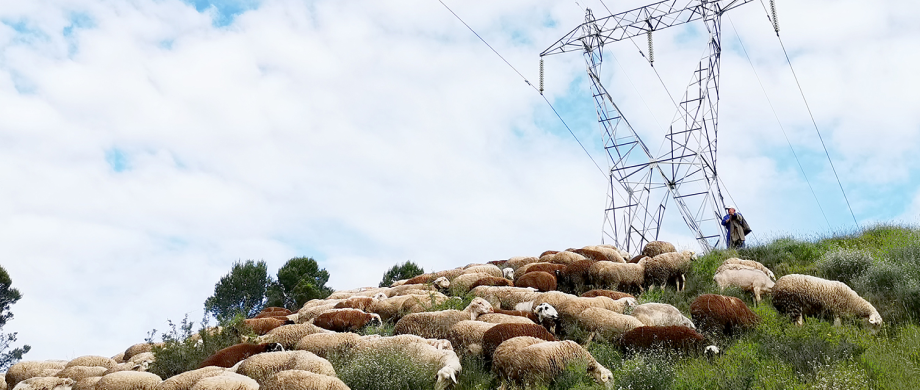
Environmental commitment
Environmental commitment
We employ bird protector devices on our power lines to make them more visible, to guarantee the coexistence of lines and birds and to protect birdlife.
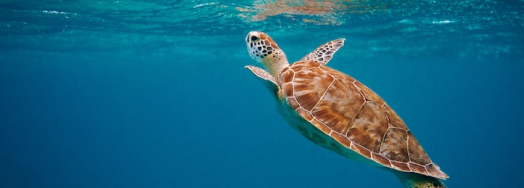
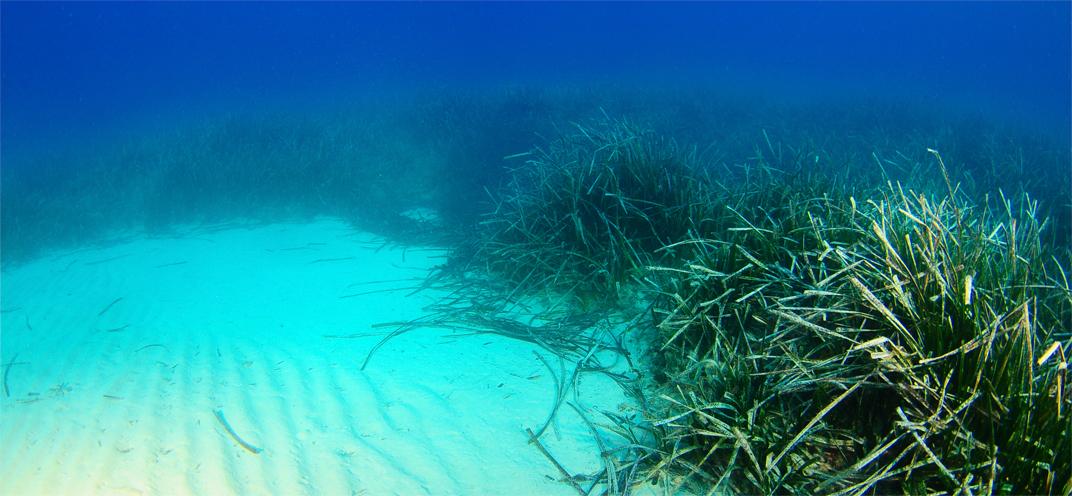
Marine forest: Posidonia oceanica
Marine forest: Posidonia oceanica
We are restoring Posidonia meadows near Mallorca with an innovative project to protect biodiversity that is a worldwide first and has been awarded the prize for the best European TSO practice of the last decade.
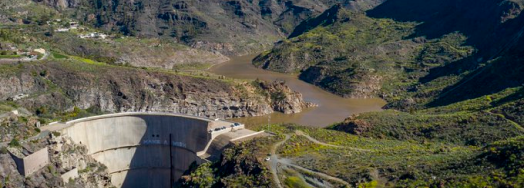
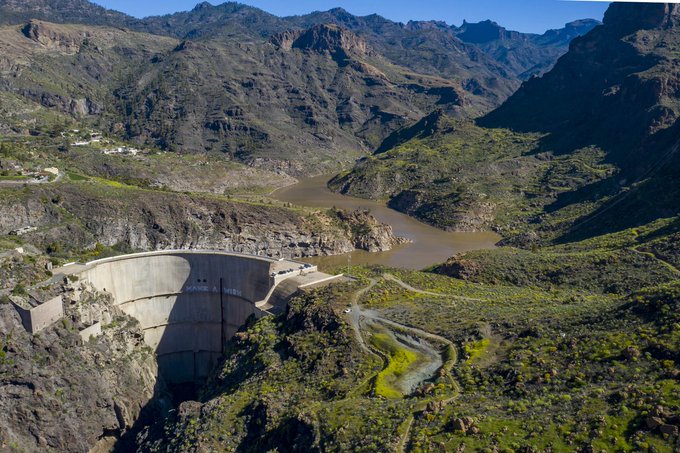
Salto de Chira
Salto de Chira
The Salto de Chira pumped-storage hydroelectric power plant is a storage project that is vital for the Canary Islands’ advance towards a new energy model that is less reliant on carbon and based on renewable energies. An innovative project that puts Gran Canaria at the forefront of storage technology.
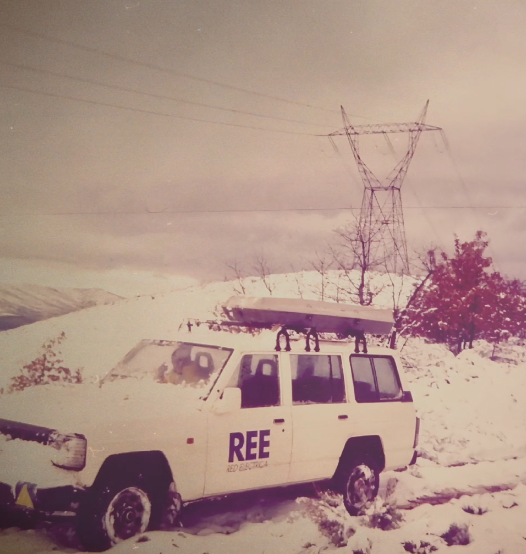
Four decades by your side
Four decades by your side
For 40 years, we've been driving our country's economic and social progress. Four decades shaping Spain.
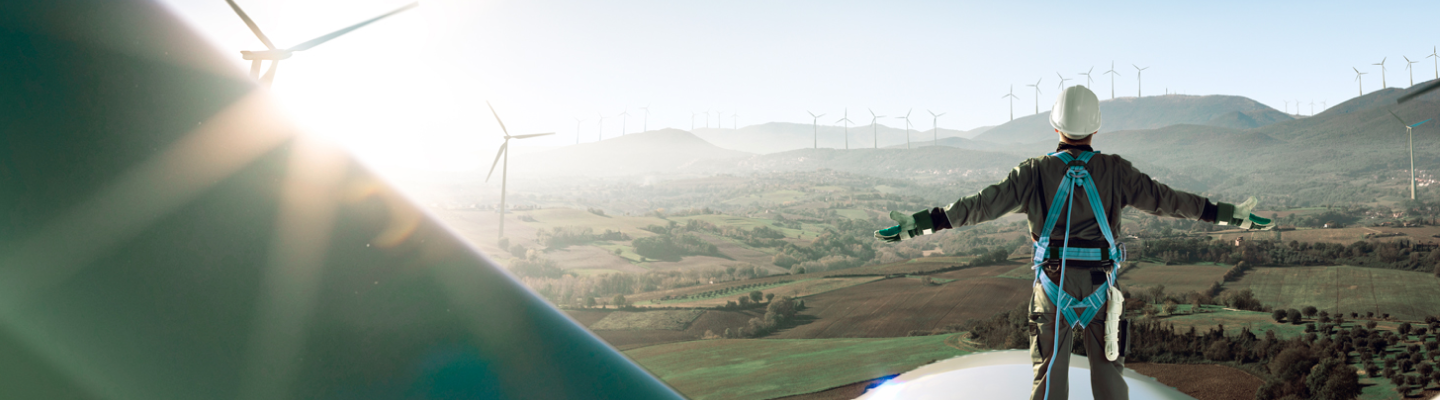
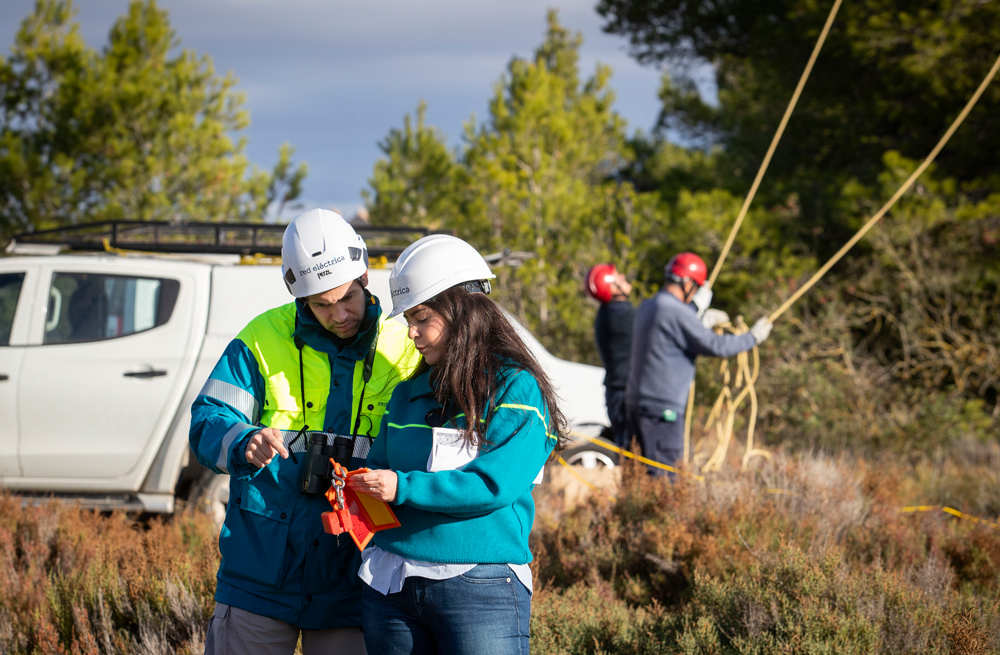
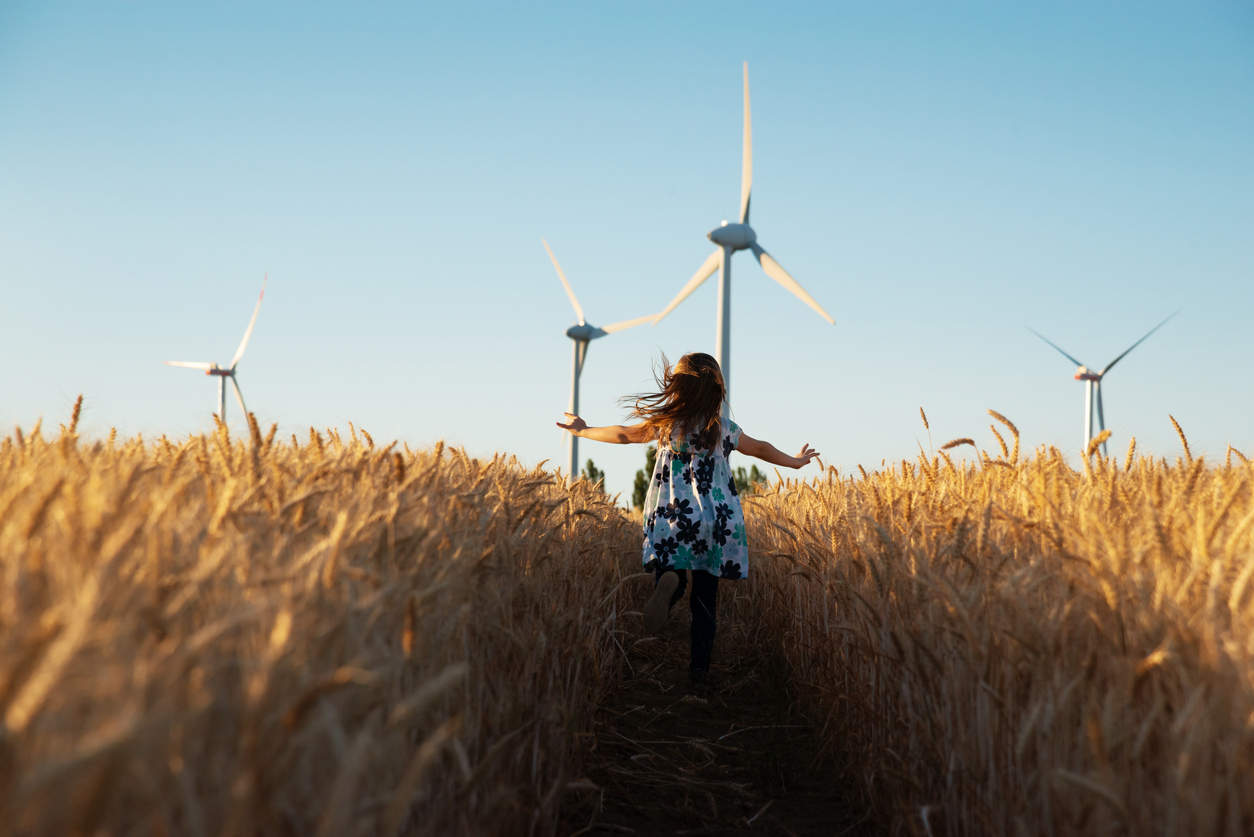
For a sustainable country
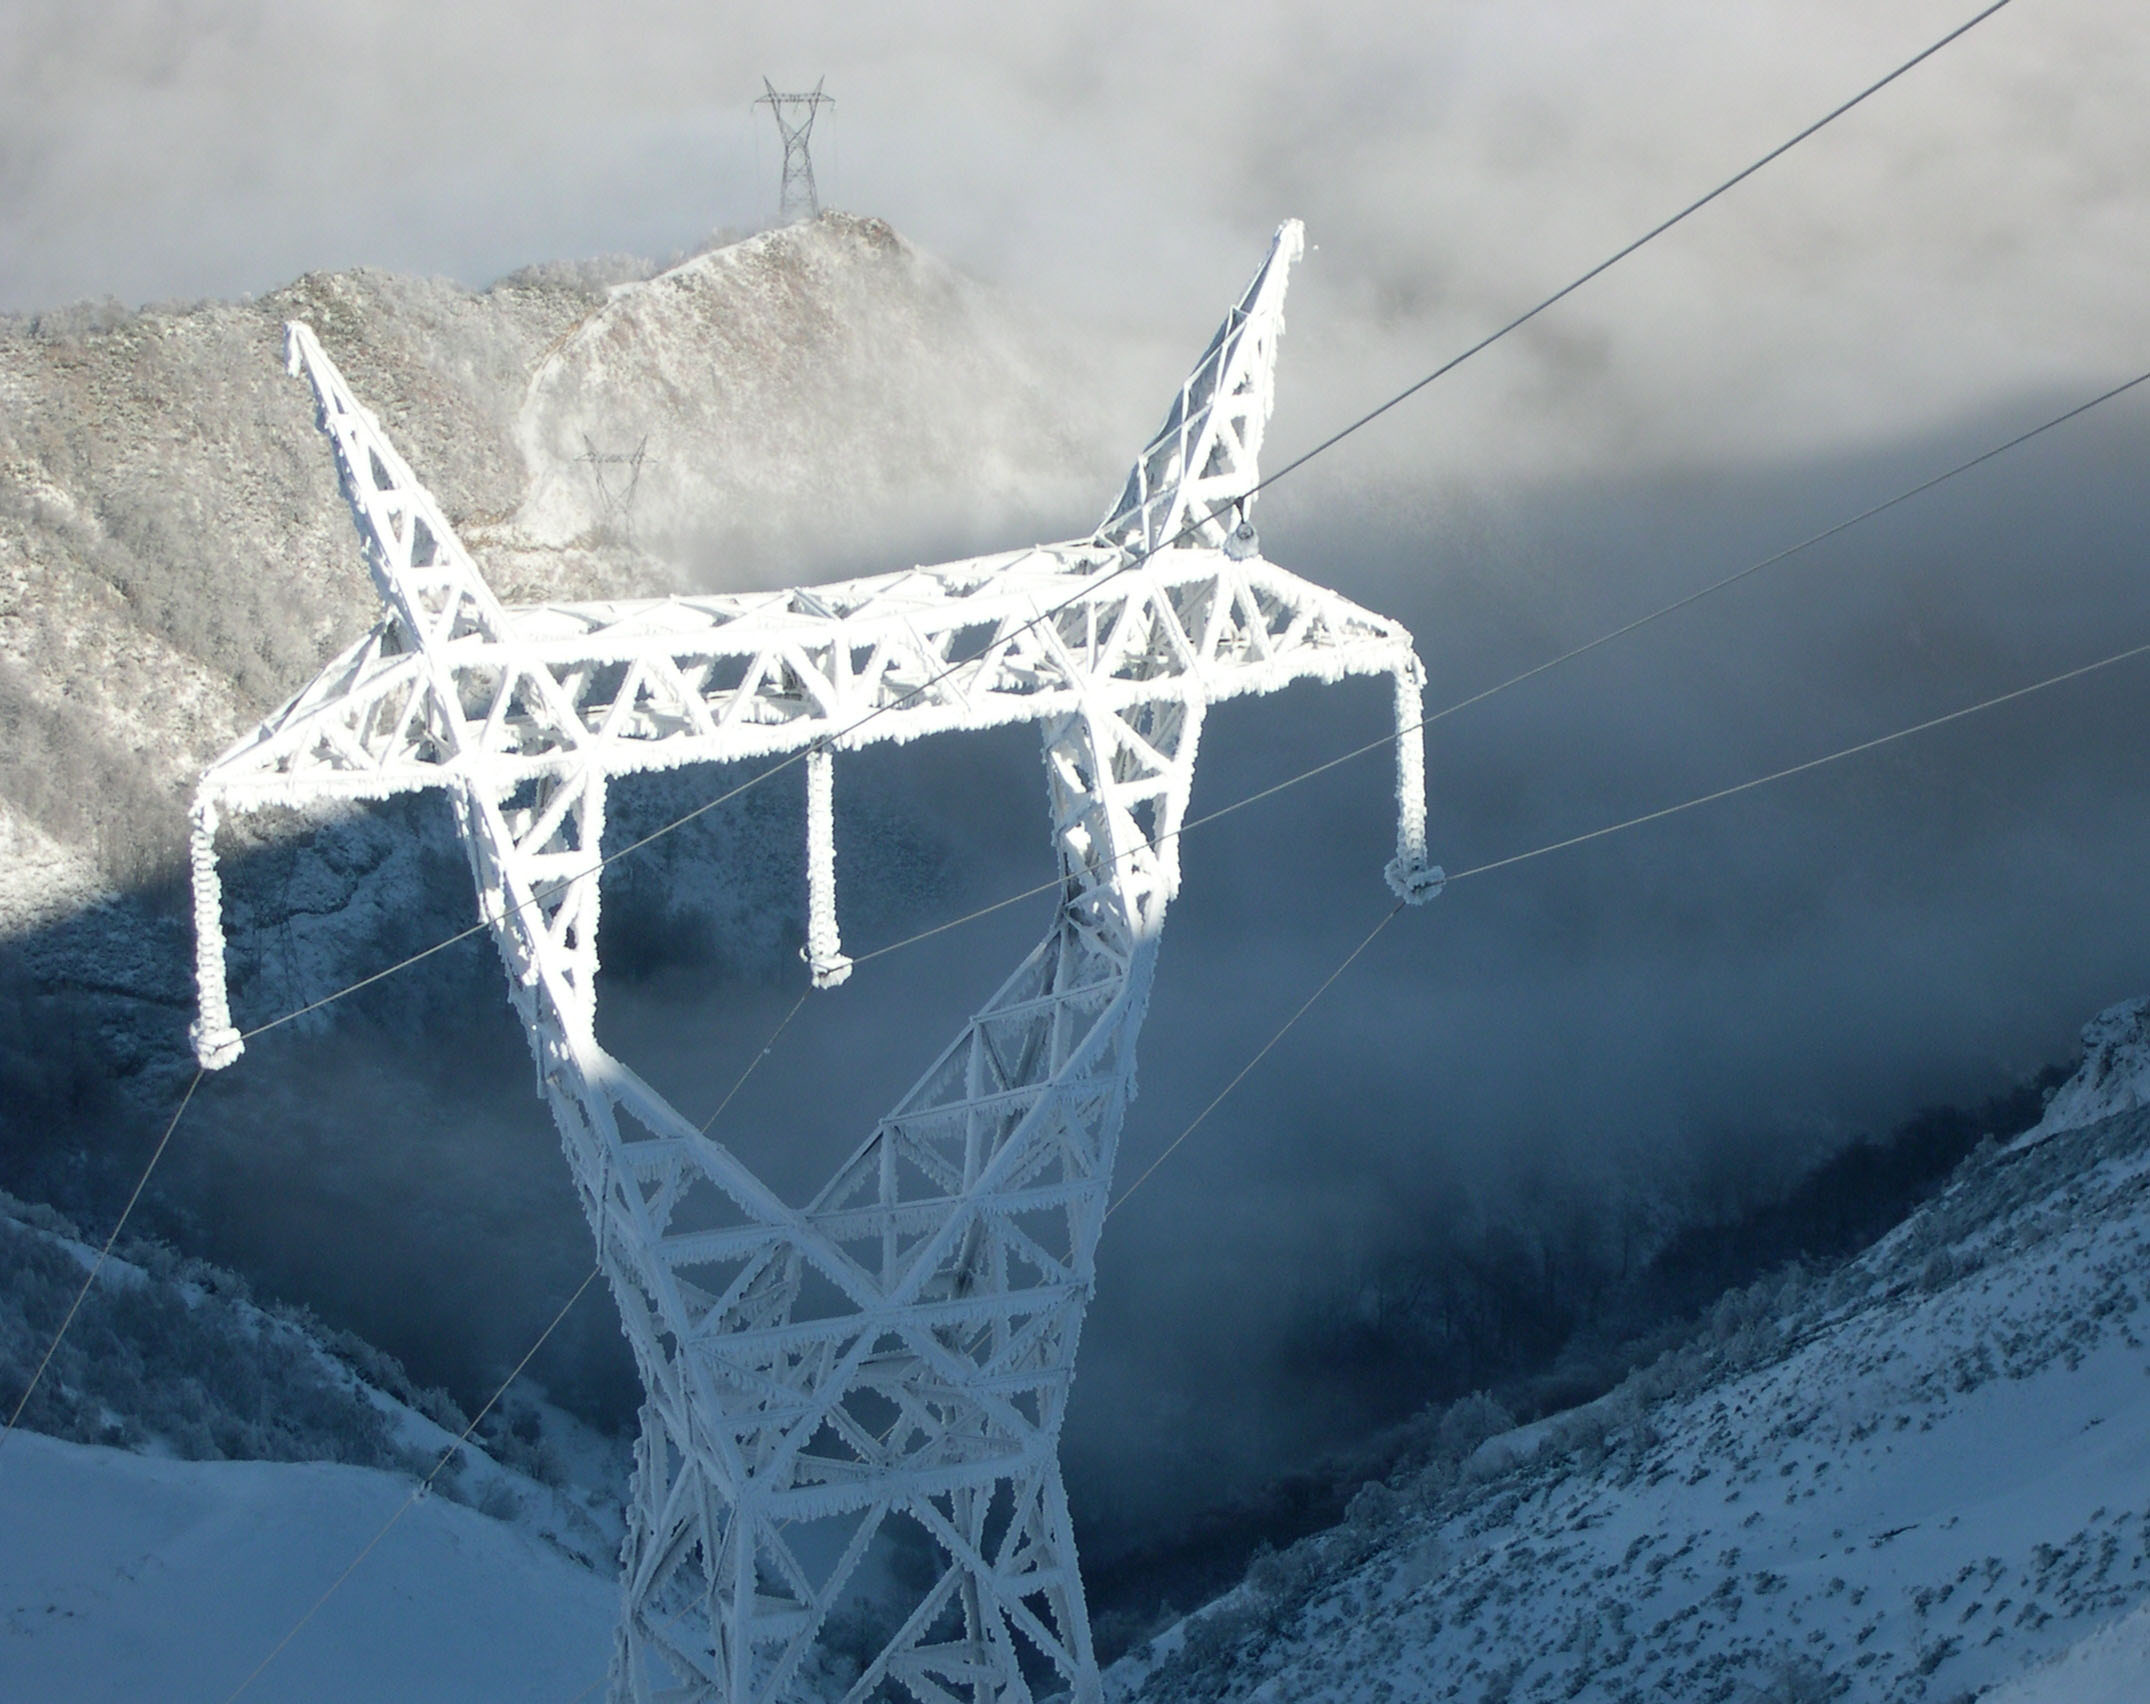
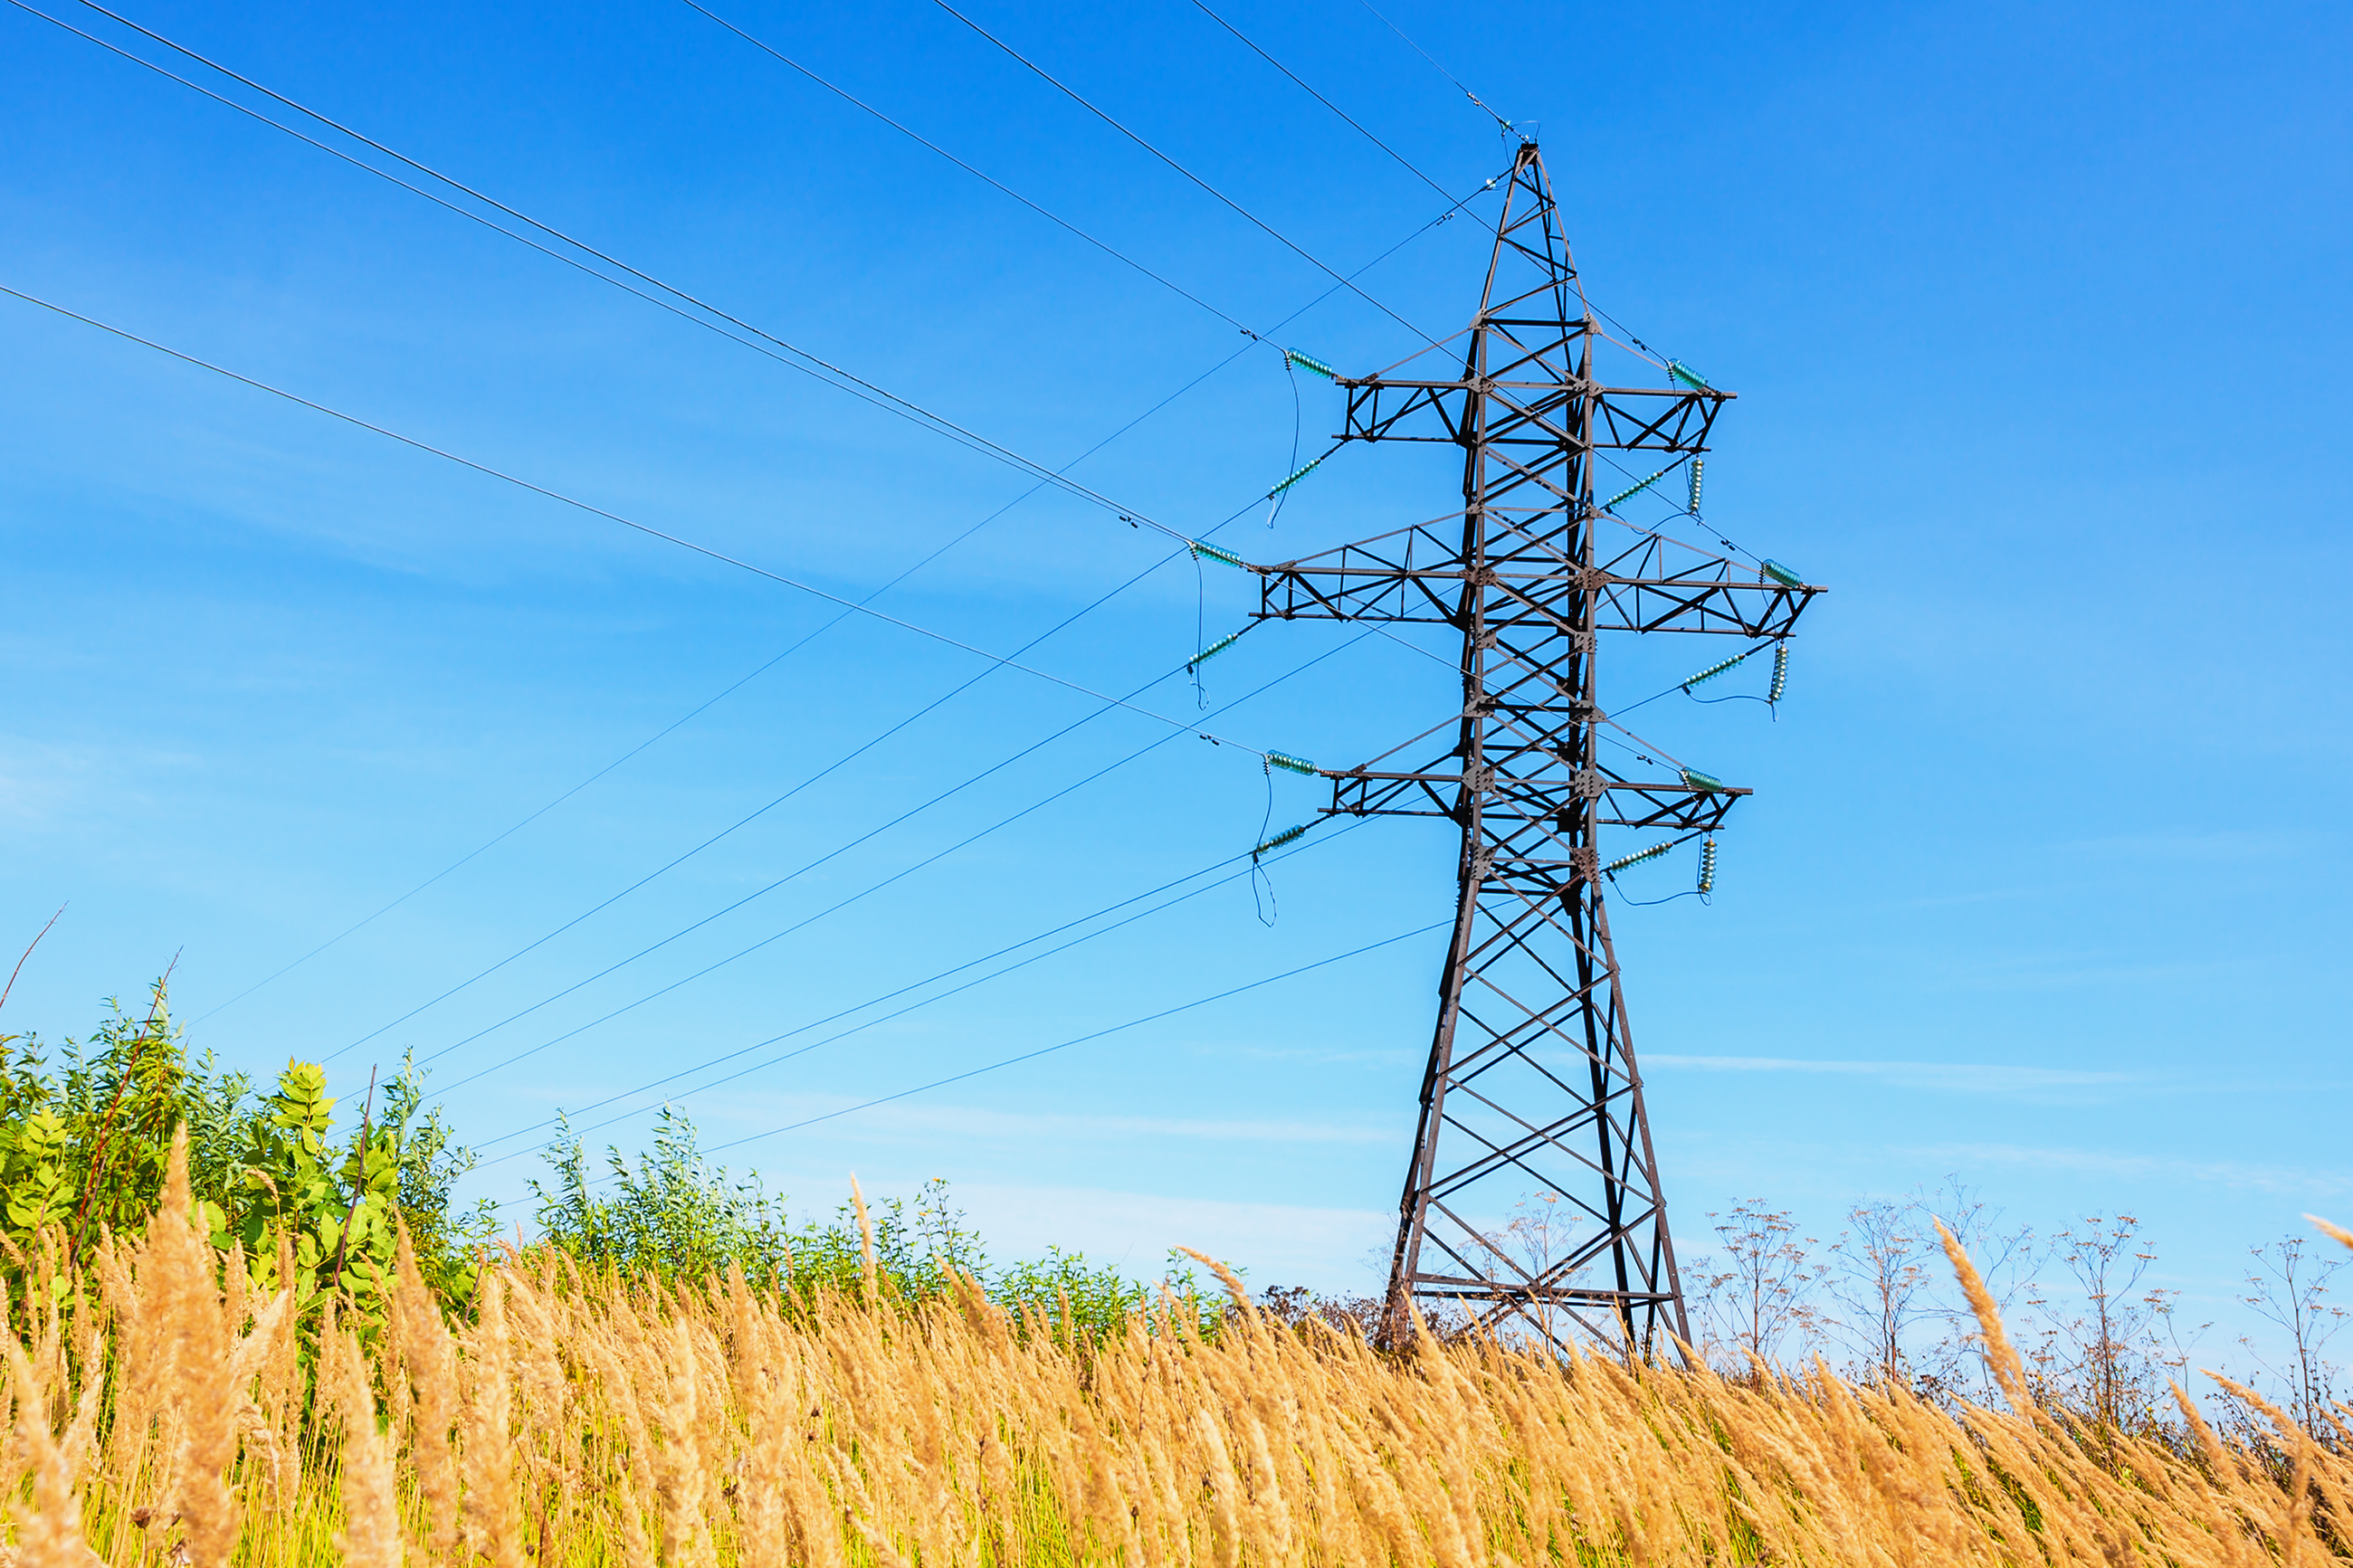
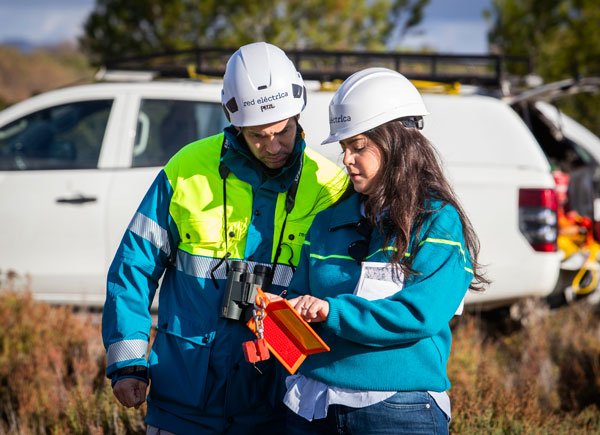
We design, deploy and manage the transmission grid with the highest standards of sustainability, and we listen to local communities to guarantee the integration of the infrastructure in the territory, to protect the environment, to create value and opportunities in the lives of its inhabitants. The grid contributes to the fair, sustainable and inclusive development of rural areas, providing solutions to challenges both local and global: the climate crisis, loss of biodiversity and social inequalities.


We apply environmental criteria that go beyond the legal limits, engaging in social dialogue and listening when choosing the location and routes of our lines and sub-stations. This is how we guarantee social and environmental sustainability and positive coexistence with other activities in the territory.
We protect biodiversity, especially birdlife, and both terrestrial and marine ecosystems. We are fighting climate change and limiting its effects, in accordance with the European Union’s taxonomy. We are lowering our emissions and handling raw materials and natural resources in pursuit of a zero footprint and circularity. We are also extending our commitment to our suppliers.
We are reducing the main inequality gaps that affect rural areas: between territories, genders, generations and digital competencies. We are creating shared value in the communities where the electricity transmission grid operates, and we are doing it with socially innovative projects based on listening processes to learn about the needs of the inhabitants and in collaboration with the third sector and universities.
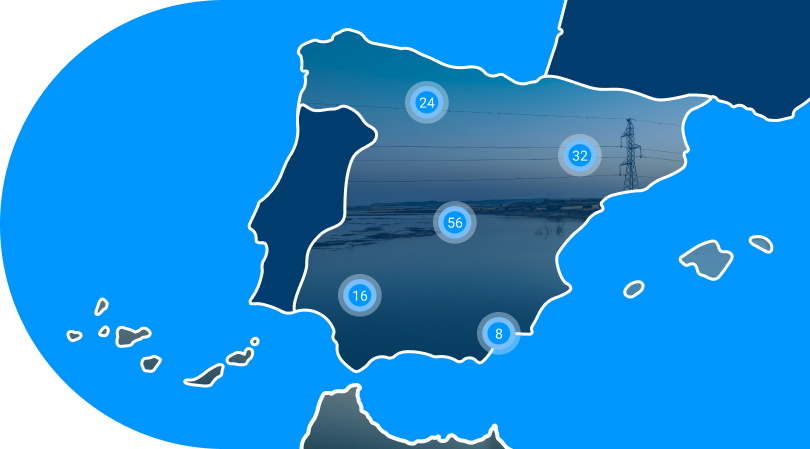
Red Eléctrica in figures 2024
+
45,500
Km of electrical circuits
56.8
%
Integration of renewable energies
97.99
%
Availability of the national grid