Real-time demand and generation
Real-time demand and generation
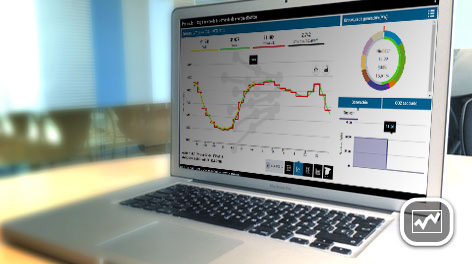 Electricity demand tracking in real time, its generation mix and equivalent CO2 emissions
Along with the graphs, information is shown regarding the different production technologies or generation mix necessary to meet the demand, including the energy to be exported and that corresponding to pumped storage consumption.
Additionally, it also shows the equivalent CO2 emissions associated with the overall set of power generating facilities nationwide and which currently represent about 17% of the total GHG emissions in Spain.
The information provided includes the total CO2 emissions (expressed in t CO2 eq / MWh) generated by each of the Spanish electricity systems as well as detailed data regarding CO2 emissions per hour and technology.
In order to calculate the emission factors of each technology and electricity system, we use different sources depending on the best availability of information.
-
The actual demand (yellow curve) shows the instantaneous value of electricity demand.
-
The demand forecast (green curve) is drawn up by Red Eléctrica based on historical electricity consumption data from similar periods, adjusting it by using a series of factors which influence consumption, such as working and seasonal patterns, and economic activity.
-
The operating schedule (stepped red line) shows the scheduled production of the generating units which have been allocated the responsibility of supplying the electricity required to meet the forecasted demand. The schedule and allocation is established through the matching of the day-ahead and intraday markets, as well as the deviation management and tertiary control markets. Red Eléctrica, based on the evolution of the electricity demand, manages the latter two markets.
The interval-based electricity demand graph also enables the peninsular demand to be analysed during different periods of time and helps check uniform behaviour in the daily demand.
